Dashboard ESRI / Pollution lumineuse
Description du projet
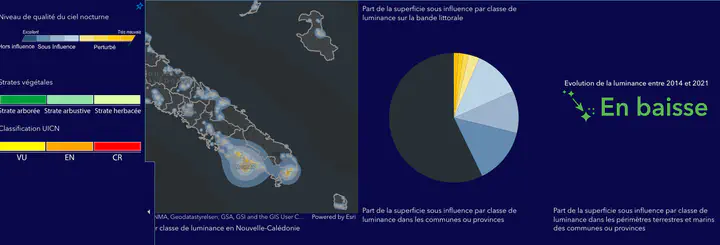
This project aims to develop an interactive dashboard using the ESRI platform to visualize and analyze environmental interest zones under pressure (gestion de l’eau , erosion, light pollution ..). Theses dashboards will integrate many detailed spatial data from plenty of data sources.
Compétences exploitées et livrables
ArcGIS Online ArcGIS Data Visualisation Data Management